Financial Modelling with Excel 2010 2013 in Belfast Northern Ireland

Course Content
1. Spreadsheet: design and structure
– Mastering key steps with practical exercises to practically design and structure your spreadsheet layout in order to achieve a well-constructed and error-free financial model
– Use tried and tested spreadsheet techniques for tracking company cash flow and monitoring profitability.
– Master the key steps in successfully building a comprehensive and accurate finance model as a decision-making tool by understanding:
- What is financial modelling and its objectives?
- The power of spreadsheets:
- Forecast future cash flows
- Ability to service debt repayments
- Coordinate various revenue and expenditure budgets
- How to avoid the pitfalls of a poorly designed spreadsheet:
- Key variables and rules
- End result of the model
- Formatting of the spreadsheet
- The layout in designing an error-free financial model
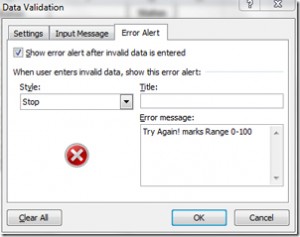
- Data validation

2. Effectively using pivot tables to enhance the functionality of your spreadsheet model
– Use Pivot Tables to perform a cross-tabulation of data, summarising them into one or more classifications.
– By creating pivot charts, which combine all the same functionality of standard excel charts with the dynamic characteristics of pivot tables, you will be able to achieve a graphic report that updates data whenever it is changed.
Learn how to:
- Understand the key features of a Pivot Table
- Prepare a Pivot Table
- Analyse and display data from different points of view
- Create a Pivot Chart from your Pivot Table

3. Developing appropriate techniques for using data tables
By constructing data tables in your spreadsheet model, you will be able to view, not only a few scenarios of your data, but also a large number of permutations that can be summarised in one table.
Learn how to apply these key techniques by:
- Examining the features of a data table
- Applying conditional formatting within data tables
- Analysing various formatting techniques
Practical Exercises
Discover how Excel can help you decide whether to undertake an investment project and correctly rank your projects.
Learn how and when to use Excel’s NPV, IRR and MIRR functions to assess your capital expenditure project by:
- Understanding the NPV rule for judging investments and projects
- Assessing the IRR rule for judging investments
- Determining the appropriate method to use – NPV or IRR
- Evaluating when IRR and NPV give the same answer
- Establishing when to apply IRR and NPV for different project rankings
- Using modified IRR (MIRR) to overcome the weaknesses of IRR


Comments